Hormuz Watch
Is the Strait of Hormuz open? An independent, source-linked live dashboard that answers the question — and shows its evidence.
- Client
- In-house product
- Role
- Concept, design, engineering
- Year
- 2026
- Status
- Live
- Live
- hormuzhub.com ↗
The brief
Why it needed to exist.
During a fast-moving crisis, the simplest question — is the strait open? — was buried under conflicting headlines and official statements. Readers needed an answer that showed its evidence and its uncertainty.
The production
What we built.
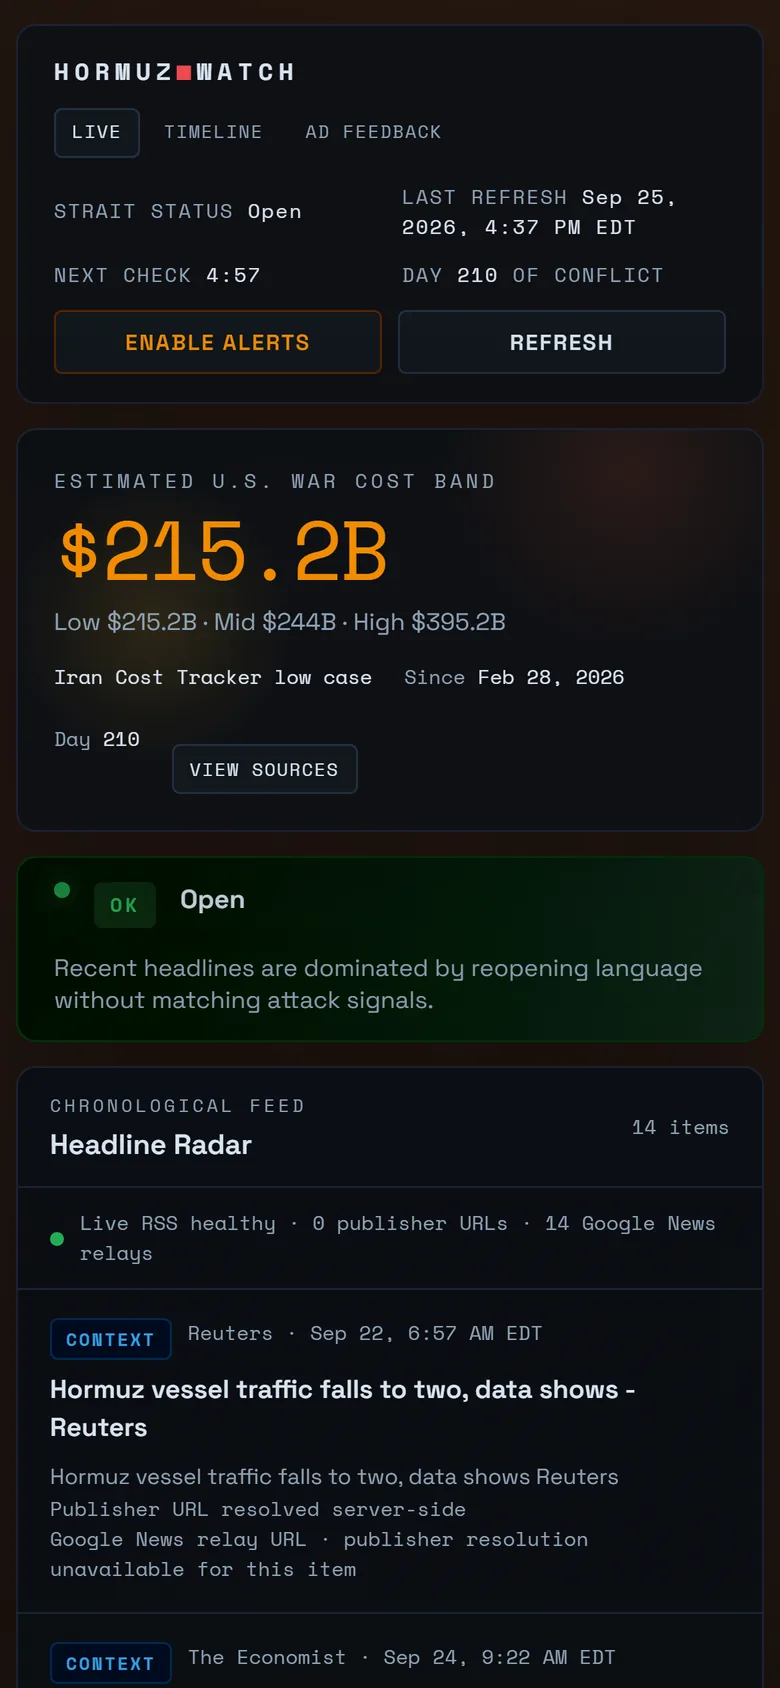
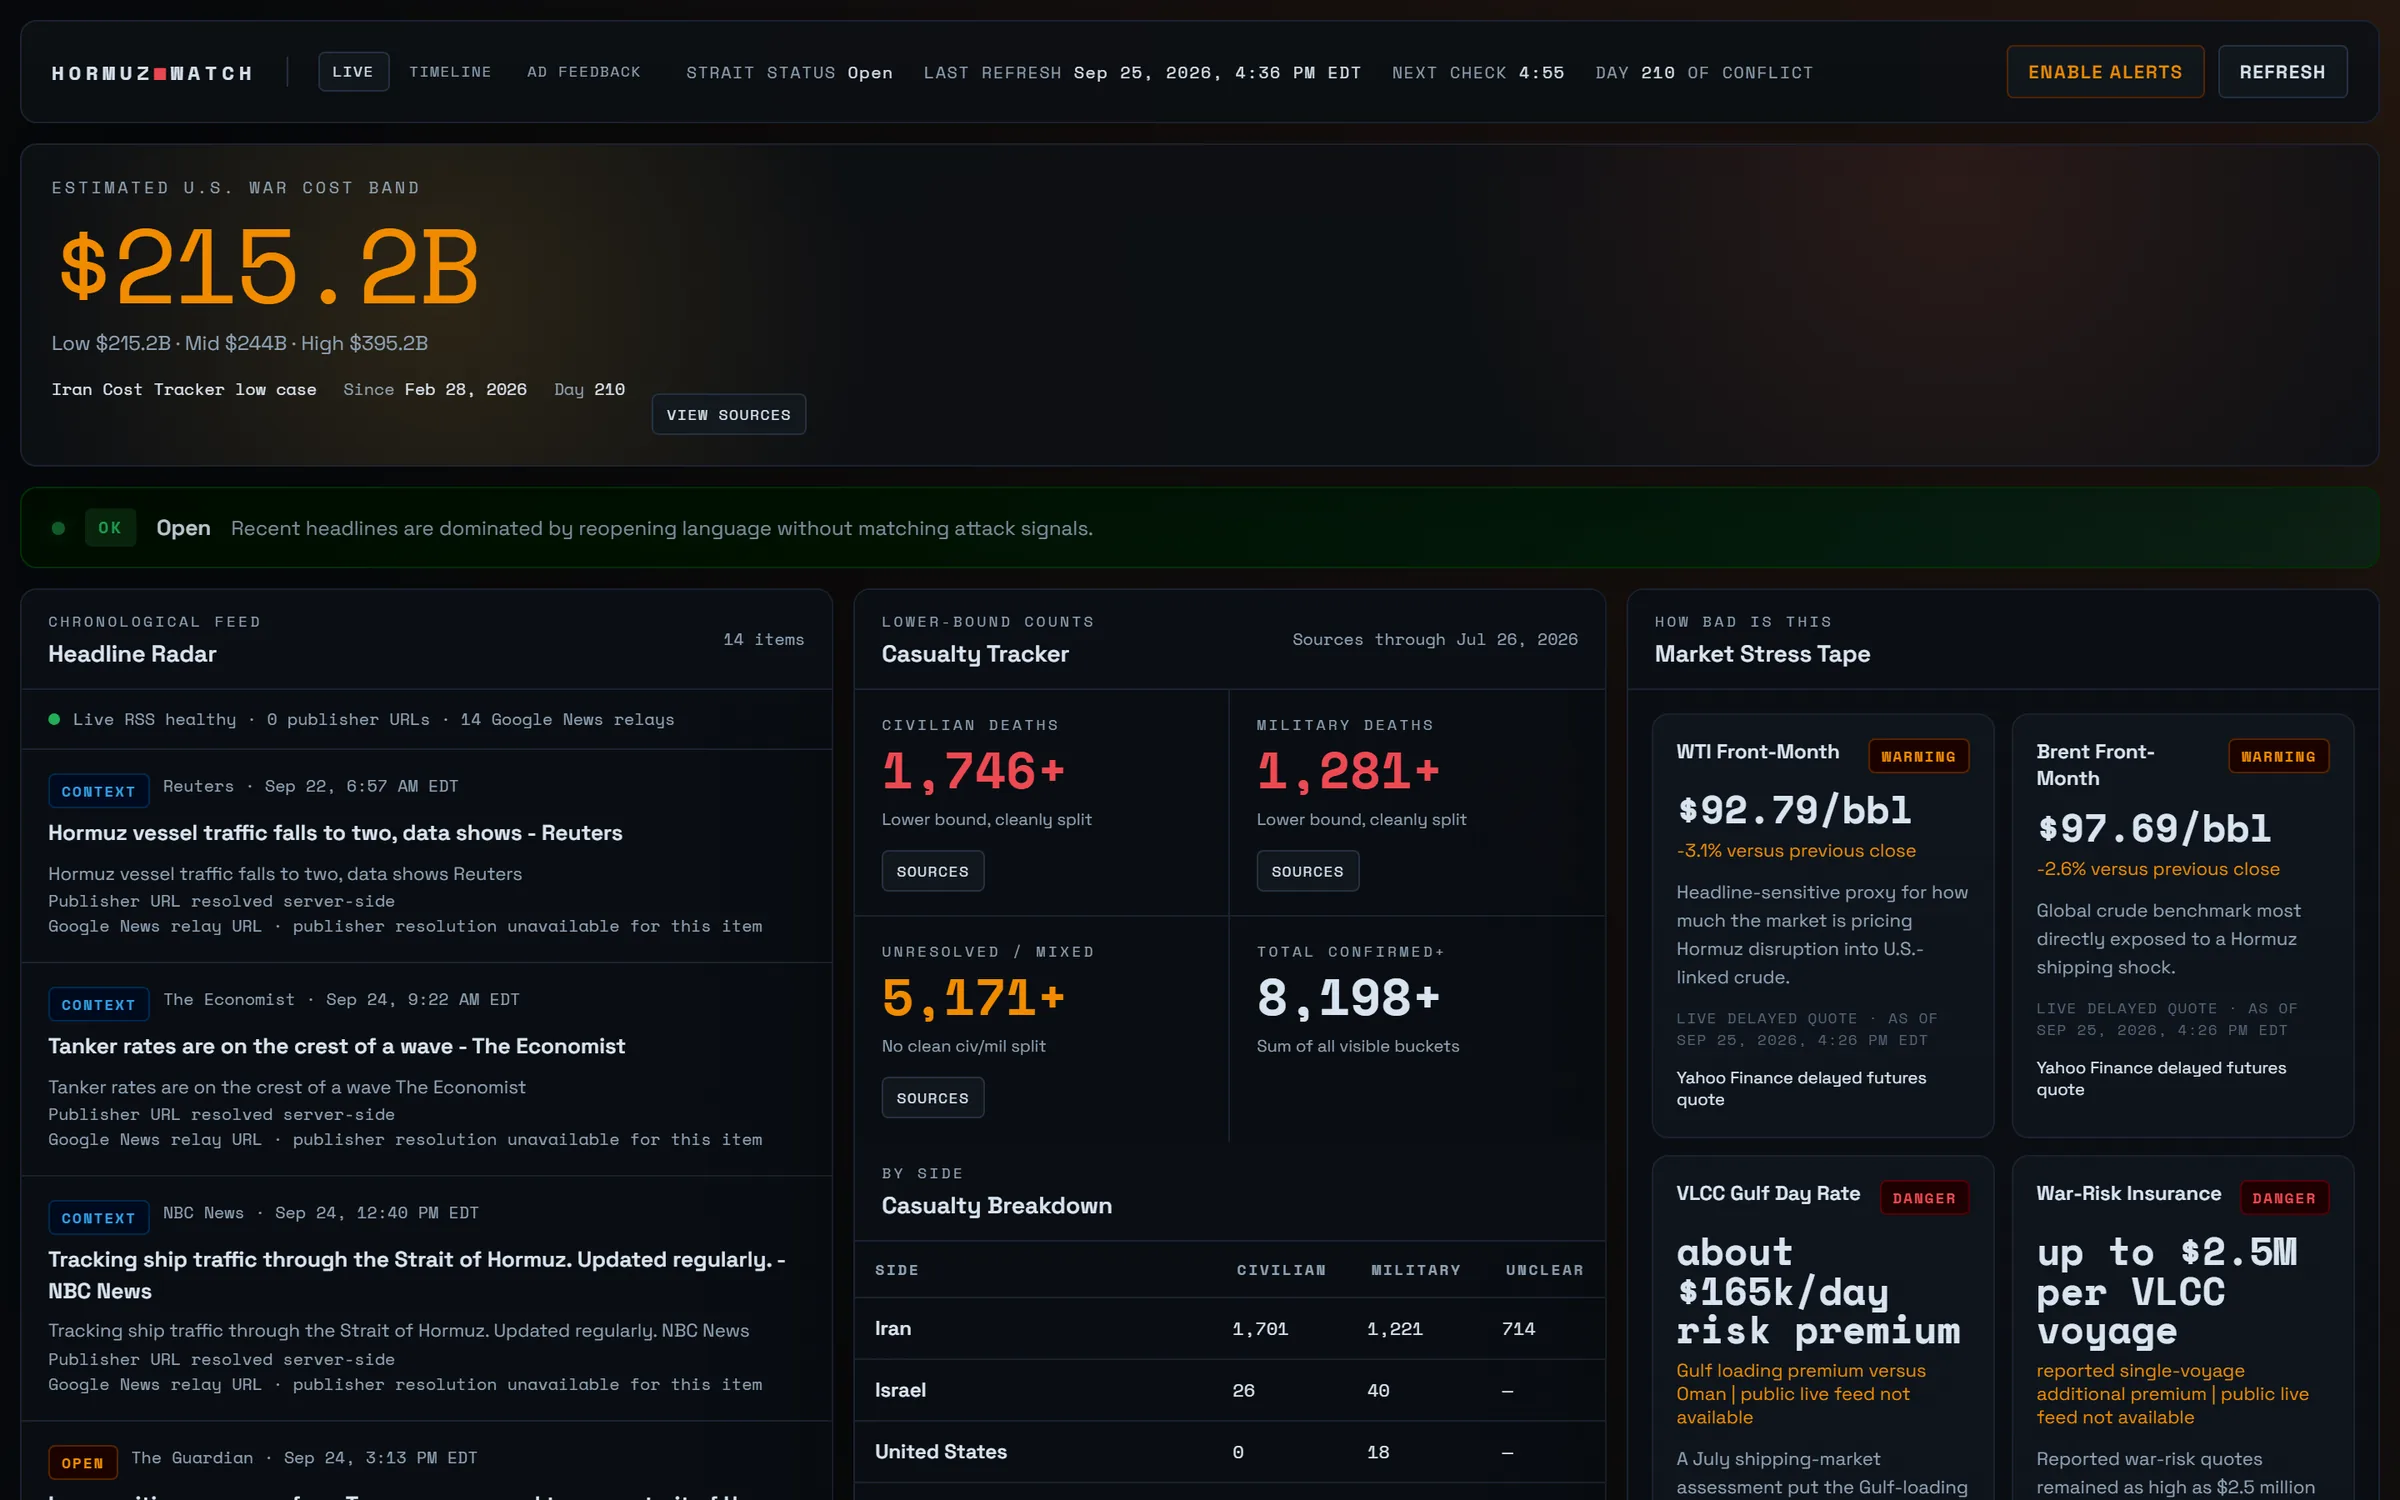
Hormuz Watch tracks the strait through an active conflict. On a schedule it re-reads the headline stream and classifies it: reopening language without matching attack signals reads as open; attacks, seizures, or gunfire alongside it read as dangerous or restricted.
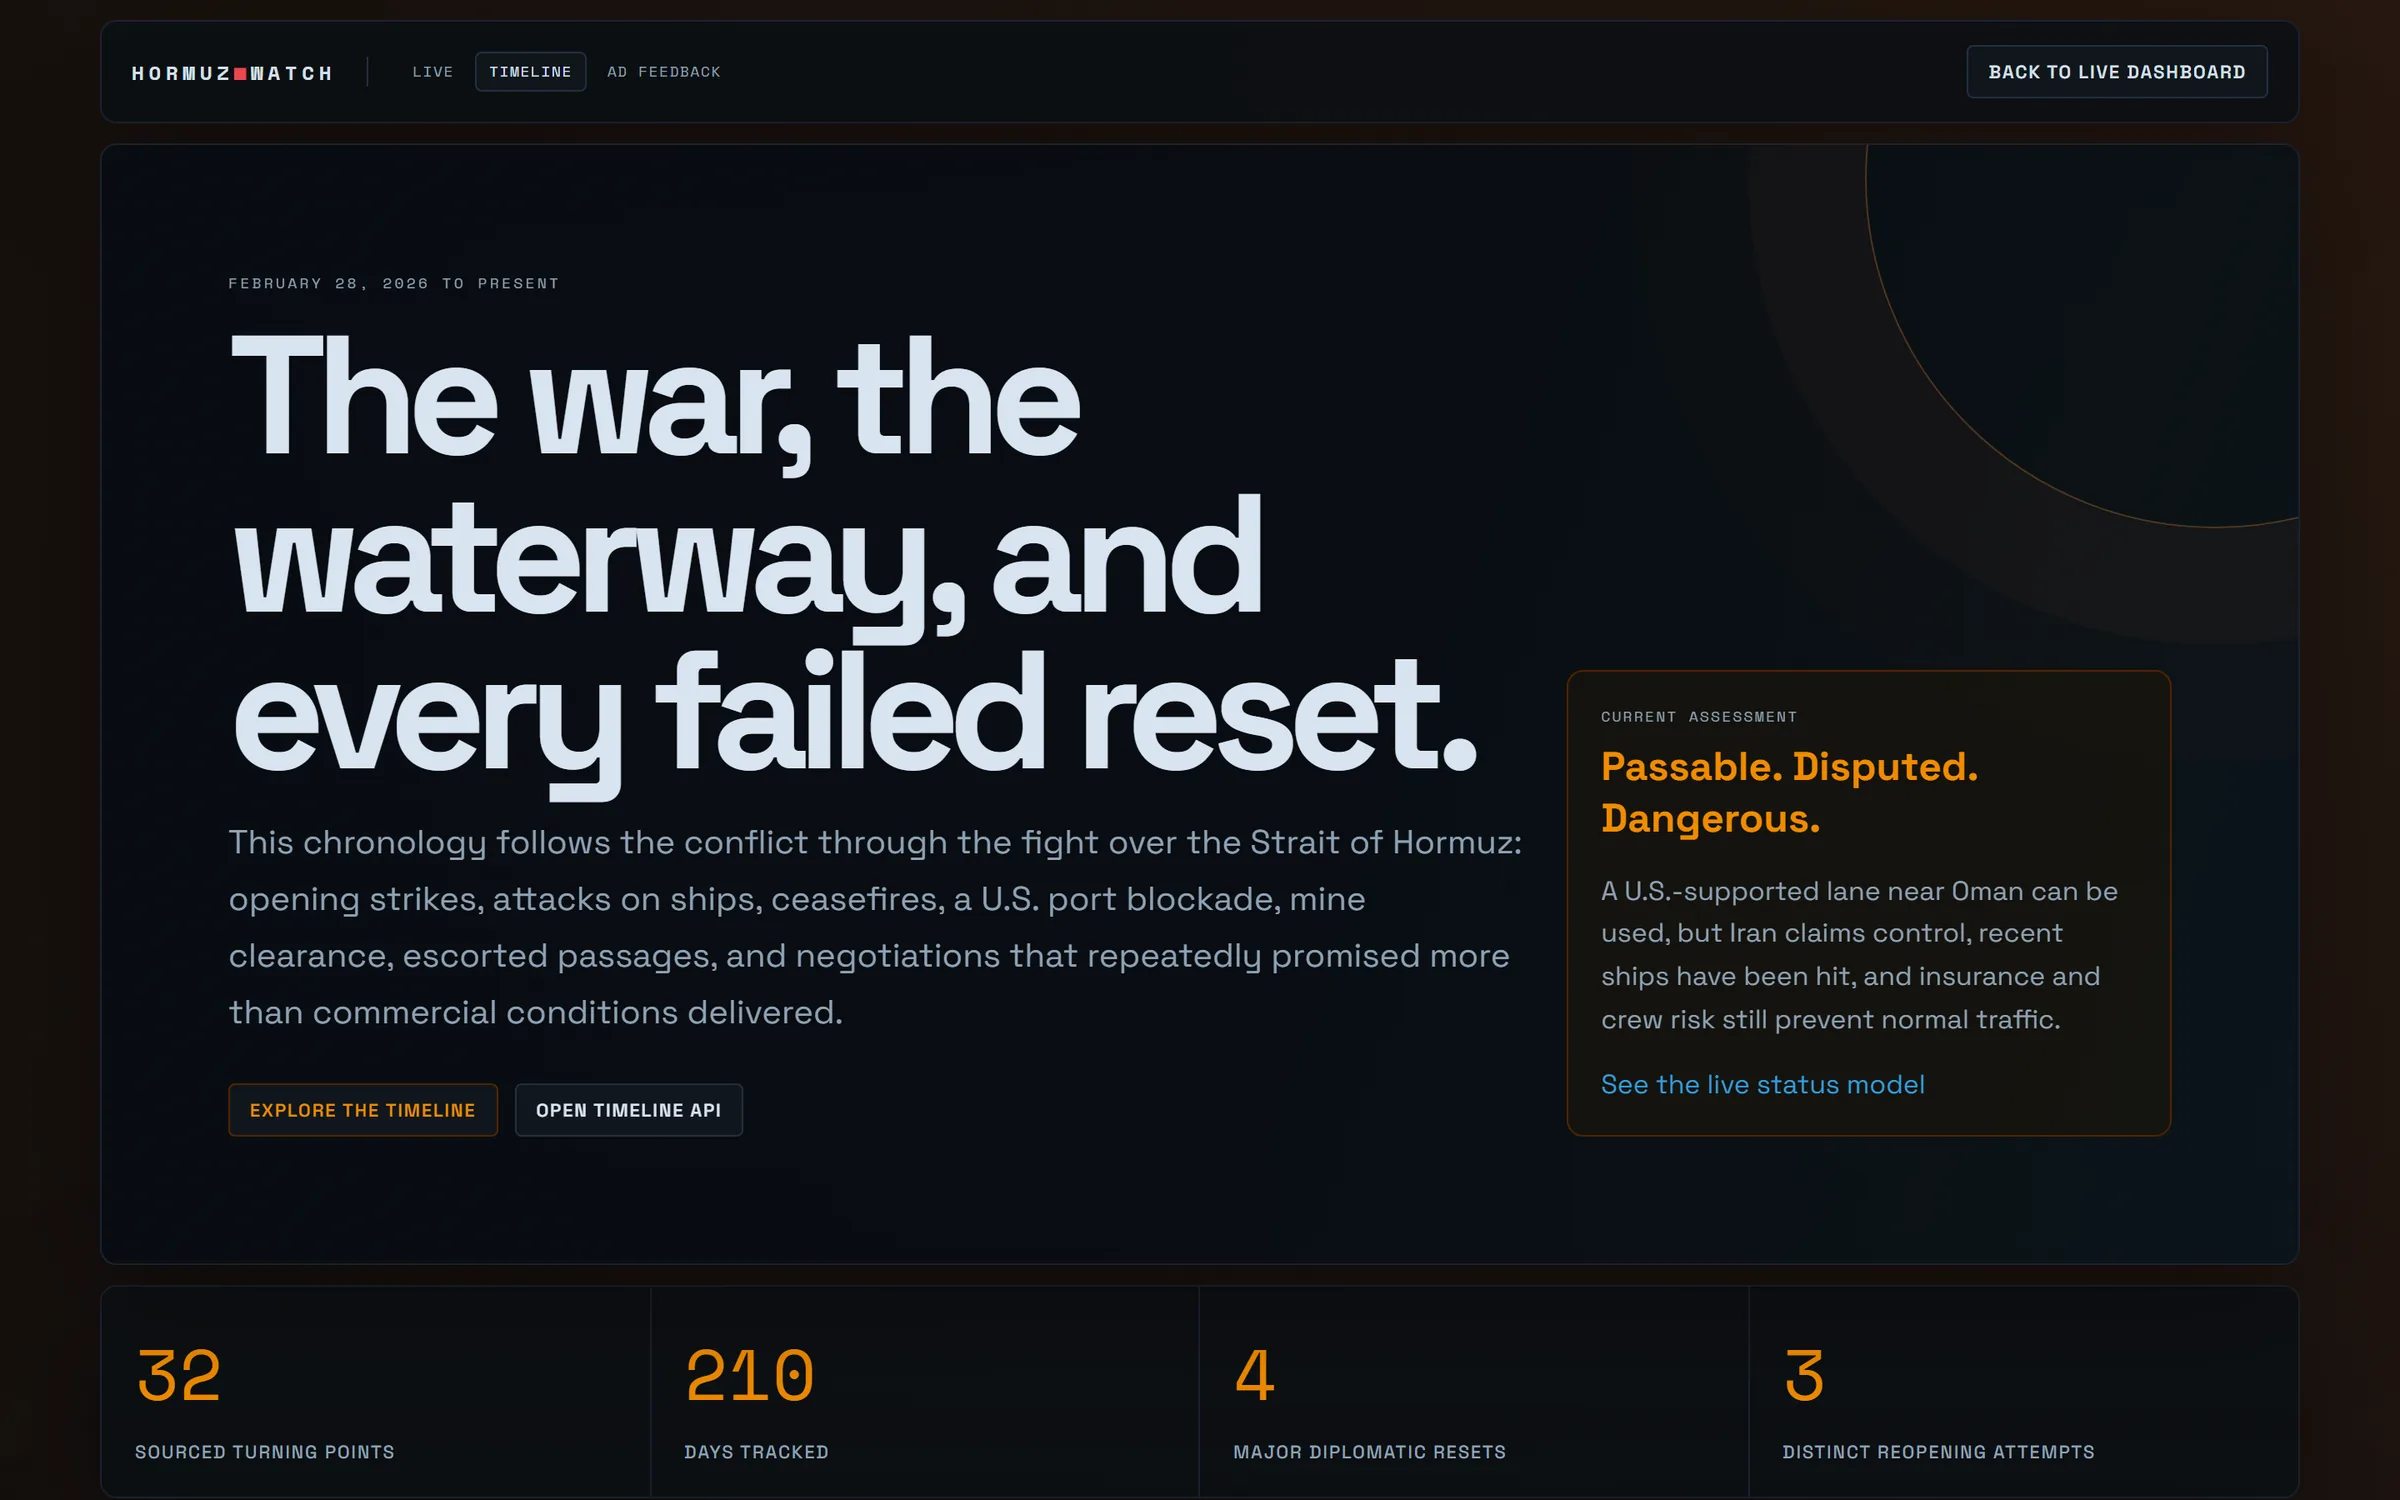
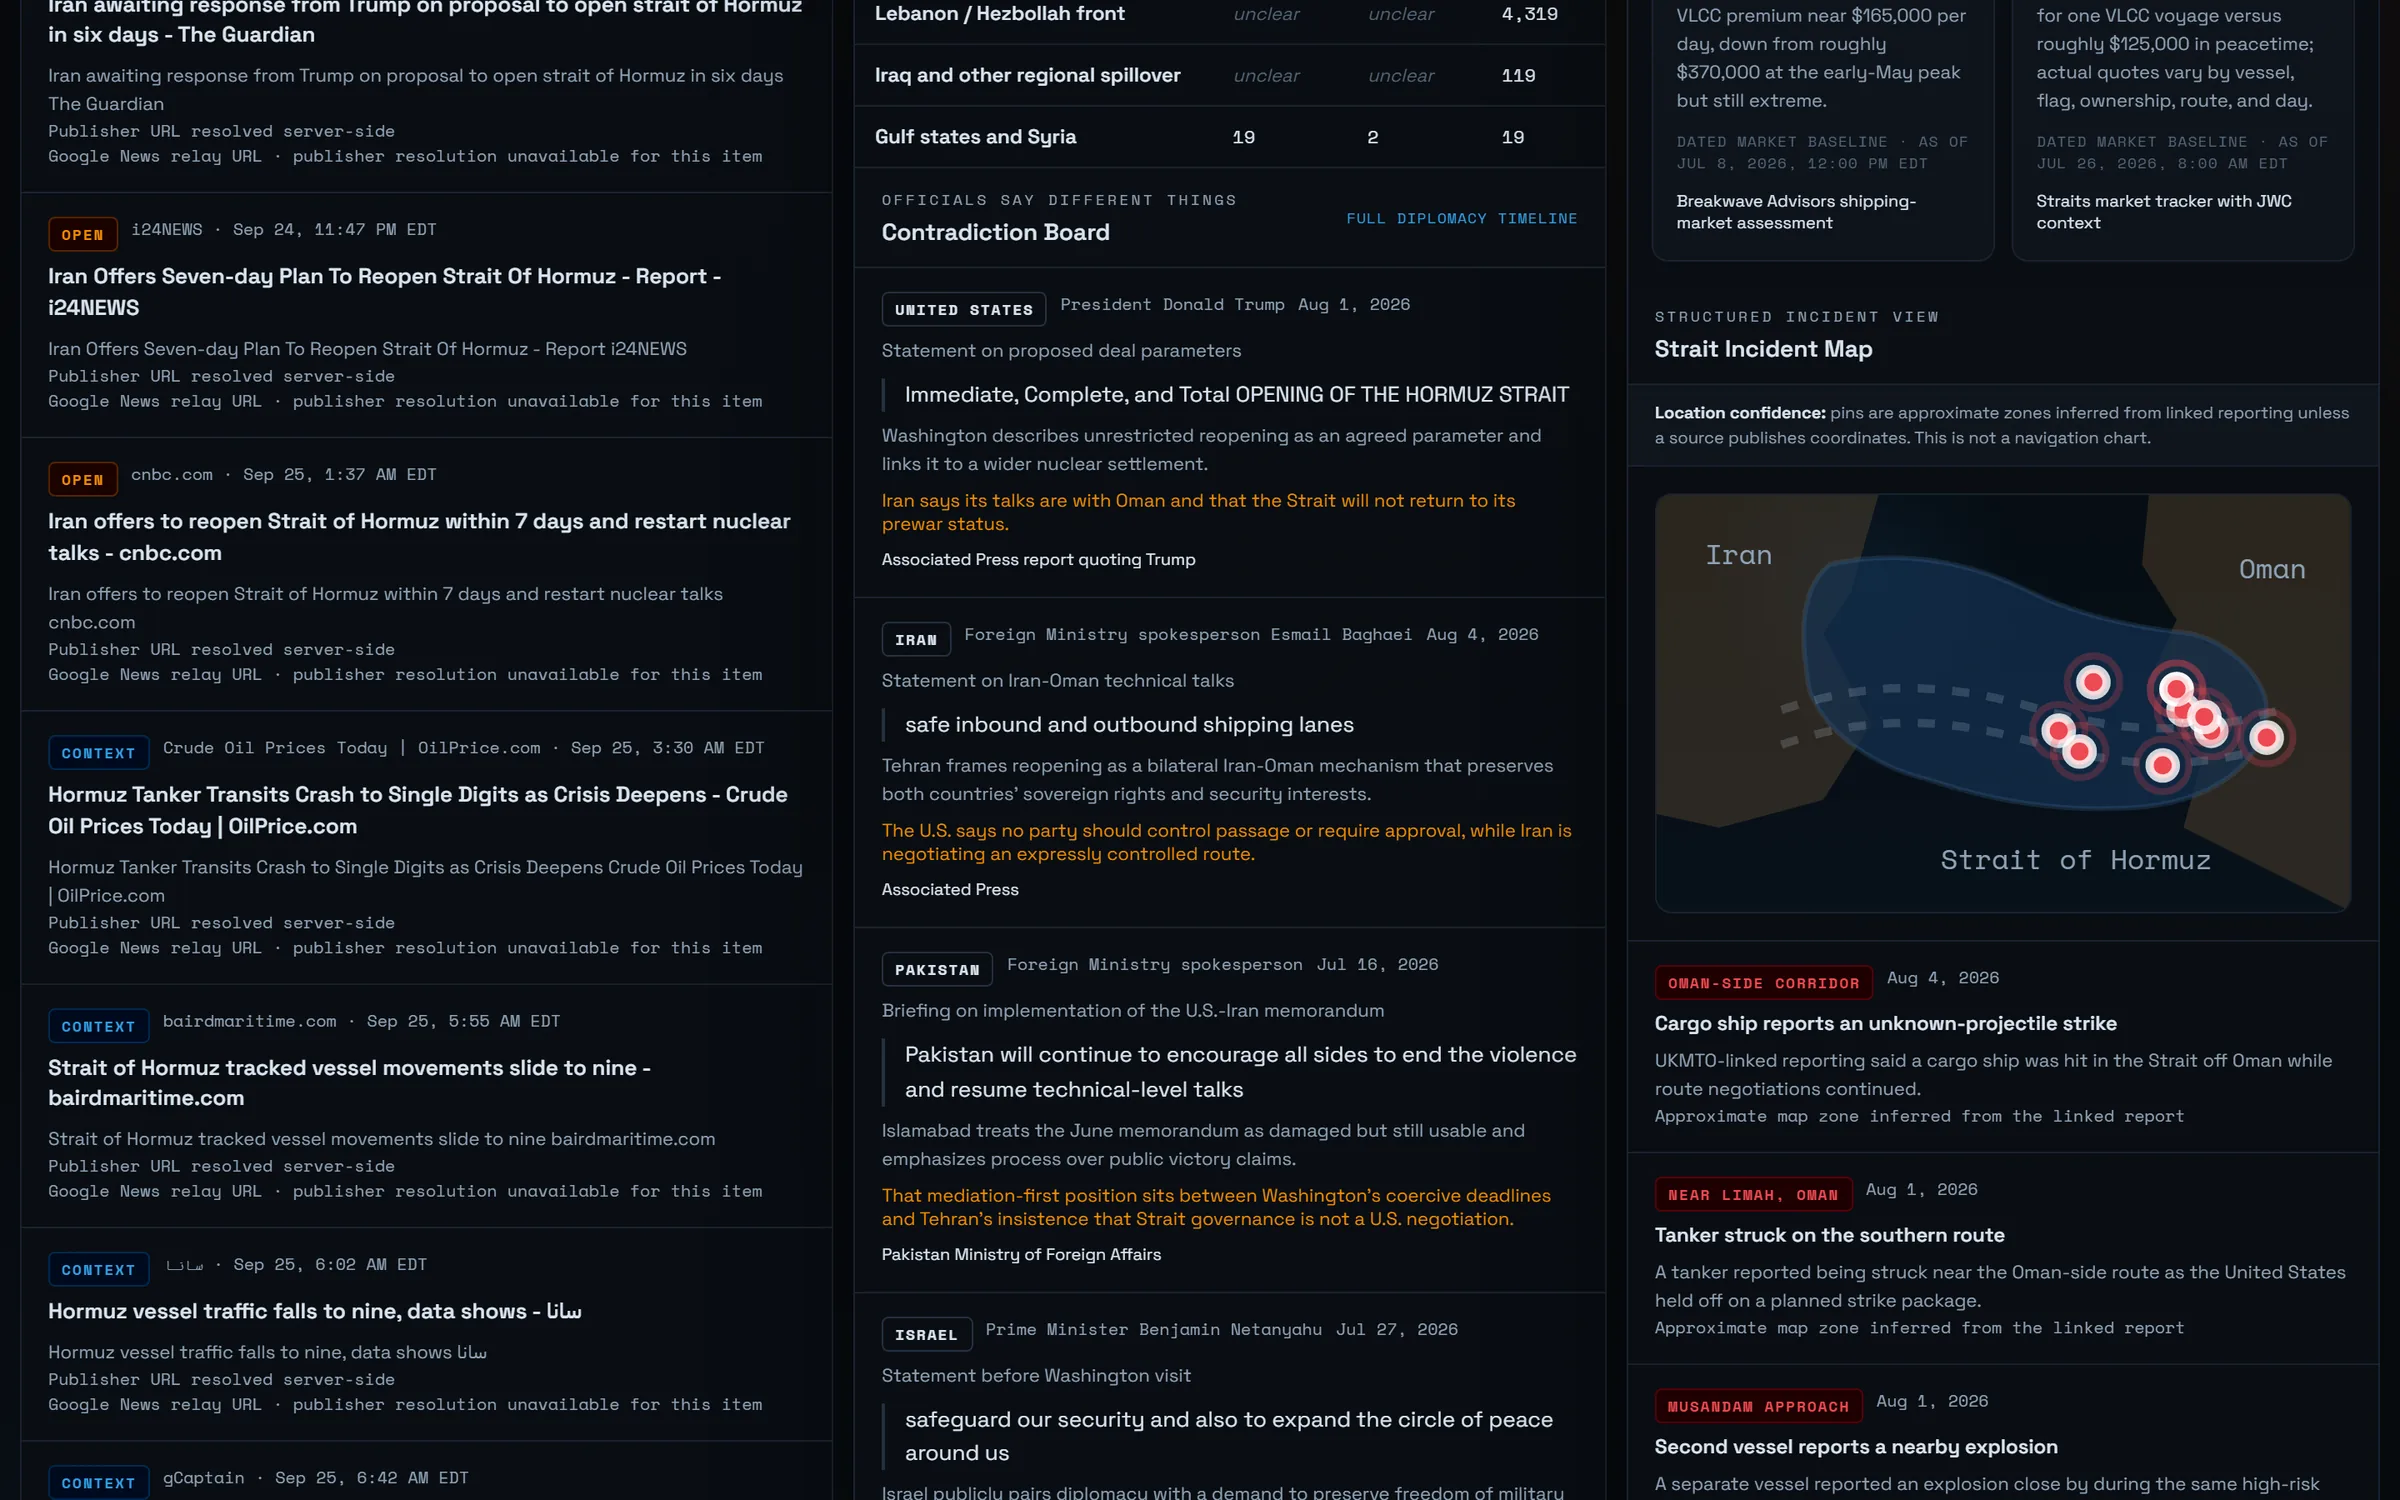
Around that status it assembles a casualty tracker with lower-bound counts by side, a market stress tape of oil futures and war-risk premiums, an incident map with stated location confidence, a contradiction board that sets officials' statements side by side, a diplomacy timeline, and a dated archive.
01A status that explains itself
The classifier's verdict comes with the headlines that drove it, and a countdown to the next check.
02Lower bounds, not guesses
Casualty counts are presented as sourced lower bounds, split by side and by civilian or military where the reporting allows.
03Contradiction board
What each government said, when, and where it conflicts with the others — side by side, with attribution.
04Honest maps
Incident pins are approximate zones inferred from linked reporting, and the map says so.
05Markets as a signal
Delayed crude futures, tanker day-rates, and war-risk insurance quotes, each with its date and source.
06Open data
Dashboard, timeline, and archive are published as JSON, with a dated snapshot for every day.
07Alerts
Opt-in browser notifications for high-risk headlines, so readers don't have to keep the tab open.
Under the hood
How it’s made.
- ApplicationBuild-free Node.js serverless API and a vanilla JavaScript front end, deliberately small
- IngestNews feeds with publisher URLs resolved server-side; delayed futures quotes; attribution kept on every item
- ArchiveDated daily snapshots stored as JSON and browsable by date
- DiscoveryPublic JSON API, dynamic sitemap, and llms.txt for search engines and AI crawlers
Stack: Node.js · Vercel Functions · Vercel Blob · News & market data feeds
Stills
From the set.